SYNOPSIS
|
My task is to predict the outcome of soccer games based on attributes of the match, such as the two teams playing, the date the tournament of the game, and the location of the game and its neutrality. It will only be handling International matches, whether it is a friendly game or in an important tournament. The relevance of this task comes from the upcoming Soccer World Cup 2018. Such a historical sports event will fuel the important market of gambling. Intense soccer fans along with many distant followers will all be making guesses and placing bets with low accuracy and success rate. Will machine learning make better soccer predictions than humans? I approached this project in two different ways. At first, I manipulated the data I was using to get a label that is a numerical value for the outcome of games. This value was calculated from the score difference of the two teams. A negative value would mean that the away team won, whereas a positive value meant that the home team won. I then tested different learners, to finally conclude that a linear regression classifier with 10 fold cross-validation had a reliably high correlation coefficient of 0.5777. However, it seemed that this approach was not the most adapted to the task. A numerical label made the predictions harder to understand as the model would predict a score difference and not the winner of the game. Thus, I manipulated the data once again to get a nominal label. Three outputs were then possible: 'H' for the home team won, 'A' for the away team won, and 'D' for a draw. With this new dataset, different classifiers performed well as they were above 50%, whereas the ZeroR baseline only achieved an accuracy score of 48.6241%. The most important features are expectedly the home team and the away team. A summary of the results can be found in the graph below. It can be drawn out of the graph that linear regression and logistic regression perform the best, but Bayes Net is reliably accurate as well, with respective accuracy scores for the last two of 57.2585% and 53.1823%. 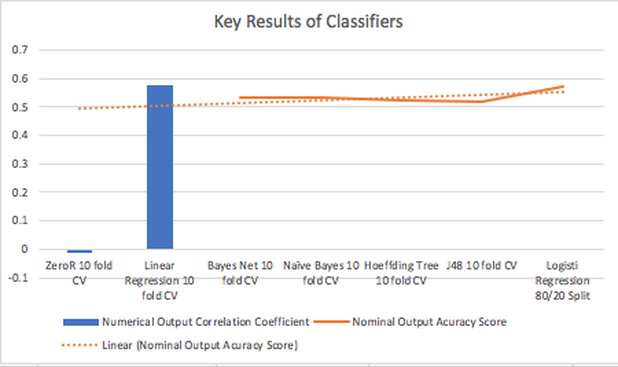
|
FIRST APPROACH
DATA |
RESULTS & ANALYSIS |
|
I have found a dataset on Kaggle.com that holds international soccer games results from 1872 to 2018. It's publisher is Marc Jurisso. It represents matches with the nine following attributes: date, home team, away team, home score, away score, tournament, city, country, and a Boolean for whether the location is neutral or not. There are 38929 matches recorded in the dataset since 1872.
To prepare the dataset for a model, I had to group the information from the attributes home score and away score into a single column that will be the output of the task. To do so, I used Anaconda with Pandas to create a column that calculated the score difference of the two teams. A negative value would mean that the away team won, whereas a positive value meant that the home team won. To further prepare the data, I deleted the city attribute as it did not seem like a helpful information and would reduce the size of the dataset and increase the speed of training. In addition, I simplified the date values by using Pandas date type, that represent dates by integer values, with the oldest dates be smaller numbers, and more recent dates be larger numbers. Finally, some string values had special characters that were not readable by the learning software Weka, so I simplified the values to simple characters only. The final dataset was structured as the following image shows. 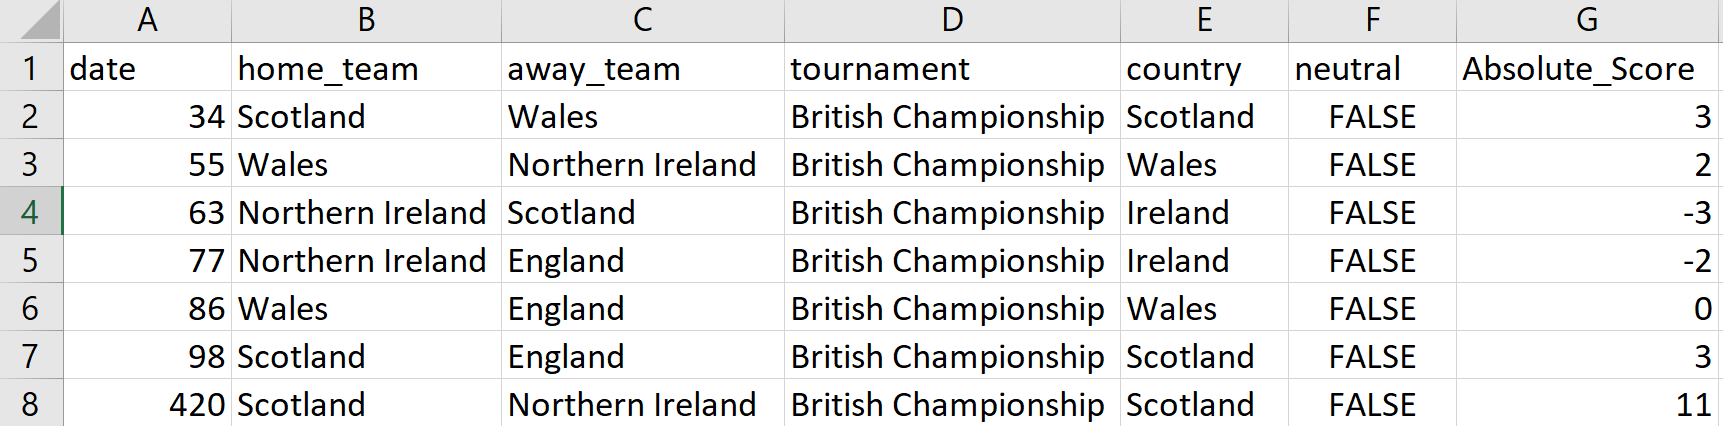
MODELFrom the beginning, it seemed that this dataset was the most appropriate for approximating function classifiers, so that it is able to identify historical trends for the international teams. I was interested to test the dataset with a multilayer Perceptron classifier, but it took more than 6 hours for my computer to build such a model for a single 70/30 split for training and testing. I then tried different test options with the Weka linear regression classifier on my data. However, with such a large dataset, a simple split would not be inclusive enough of all the data. Thus, a 10 fold Cross-Validation test on my data with a linear regression classifier was the most appropriate model.
|
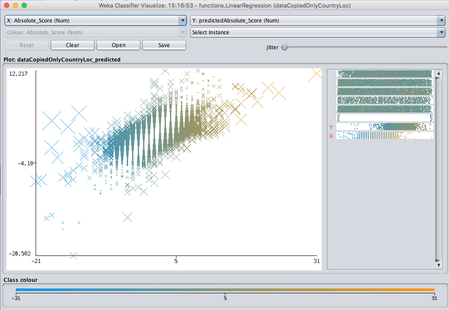
This model's output seemed very promising. While the ZeroR baseline only achieved a correlation coefficient of -0.0148, the 10 fold Cross-Validation with a linear regression classifier model achieved a correlation coefficient of 0.5777. The visualization graph provided by Weka was very revealing on the model.
The left graph plots the matches as points along a X axis representing the actual values, and a Y axis representing the predicted value. However, those results are not the most adapted to the main task. We are trying to predict the winner of a match if it is not a draw, whereas this model predicts the difference of score between the two teams. Even though there is a strong correlation for such an unstable sport, more simple outputs were needed. |
UPDATED APPROACH
DATA |
RESULTS & ANALYSIS |
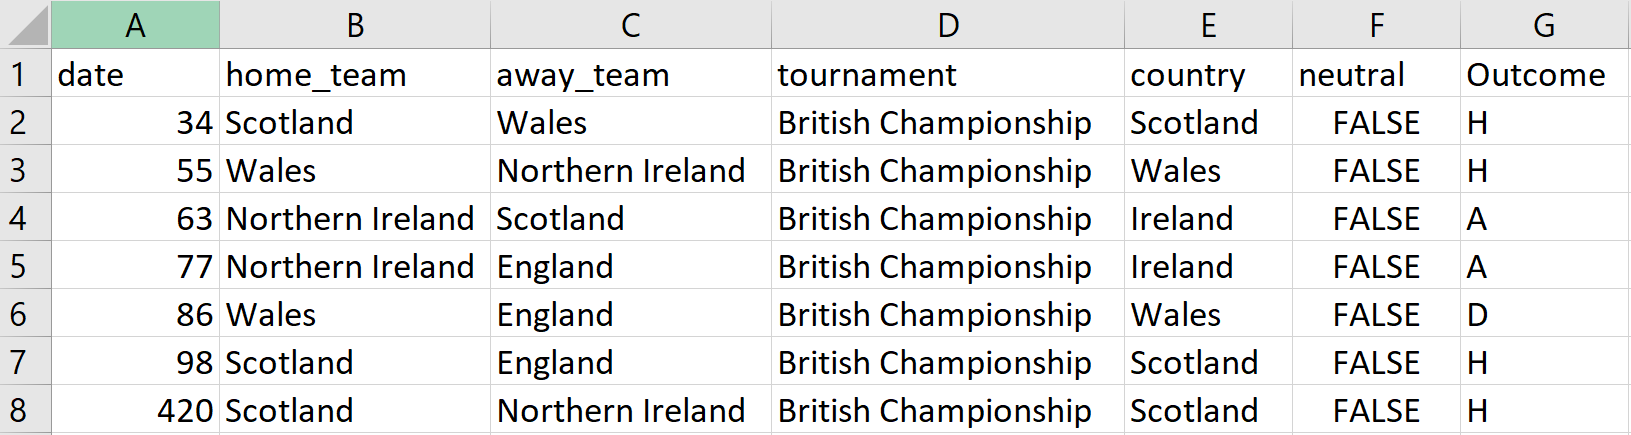
For this second approach, I modified once again the same dataset I was using previously. In this new one, the column that held the score difference between the two teams was then simply entitled 'outcome' and held three possible string values: 'H' for the home team won, 'A' for the away team won, and 'D' for a draw. The updated dataset was structured as the following image shows.
MODELS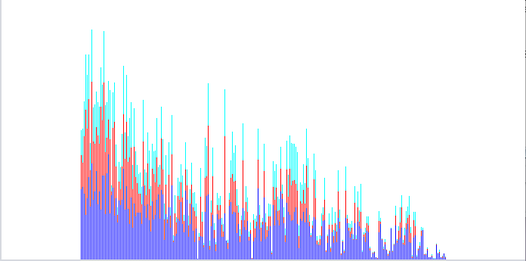
Now that I had a more simple dataset with a nominal label, many more classifiers on Weka were appropriate that I could test and choose from. Mainly, I tested three types of classifiers. The first type was two Bayes classifiers, BayesNet which is Weka's Bayes Network classifier, and Naive Bayes. Bayes classifiers' statistical probability approach was relevant to such a large dataset of matches. The second type of classifiers was decision trees. I specifically focused on the J48 and the Hoeffding classifiers. Decision trees also seemed to be relevant to the task and the format of the dataset, as it is mainly composed of nominal values and I could imagine decision separations made on different teams. However, Weka's preprocess visualization of the data exposed that it would not be a very efficient method. As shown in the figure below, the home team attribute did not give efficient delimitations for the outcome of the game (the outcome is represented as the color portions, where the home team are represented as the bars). Similarly, the away team attribute did not give efficient delimitations as well.
All of the classifiers mentioned above have fast training times, allowing me to use 10 fold Cross-Validation to get the most realistic accuracy scores. The final type of classifier is a regression classifier. Weka's multinomial logistic regression classifier could transform nominal attributes into numerical attributes. However, this classifier has a very slow training time, which leaves out 10 fold Cross-Validation in order to minimize the training time, so I used 80% of the data as a training set and the other 20% as a testing set. |
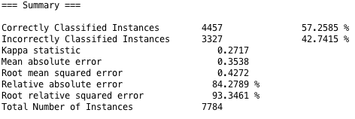
These five models achieved accuracy that I expected. They all had successful accuracy scores above 50%, while the ZeroR baseline only achieved an accuracy score of 48.6241%.
The first model I tested was the Naive Bayes classifier along with a 10 fold Cross-Validation. This model had an incredibly fast training time, an achieved a 53.1257% accuracy score. The second model with the Bayes Network classifier along with a 10 fold Cross-Validation achieved a very similar accuracy score of 53.1823%. The two following models had slightly lower accuracy scores. The Hoeffding Tree classifier with a 10 fold Cross-Validation resulted in an accuracy score of 52.2855. The J48 classifier with, again, a 10 fold Cross-Validation achieved 51.7793%. While those model are still successful compared to ZeroR, they are expectedly not the best models as the data attributes did not offer clear output delimitations. Finally, the most successful model is the logistic regression classifier with a percentage split of 80% for training and 20% for testing. This model achieved the highest accuracy score of 57.2528%. This accuracy score was a lot higher than I expected as betting website models do not have better accuracy scores than 54%. However, the model's results need to be interpreted carefully as it is not tested with a 10 fold Cross-Validation like the other models due to a too long training time. A clear visual comparison of the different models' results can be found below. Overall, the experiments were conclusive and successful as the dataset provided enough simple instances, allowing the classifiers to perform well. 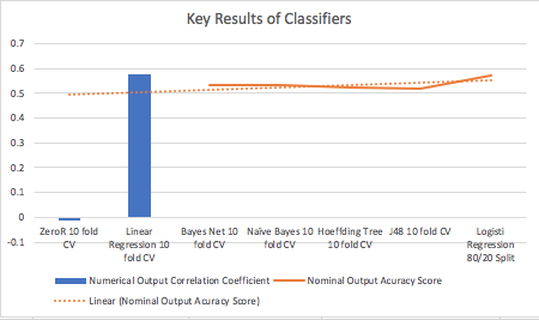
FUTURE WORKAs the World Cup is onto us, the different models can be used to try predict the outcomes of the games, and, ultimately, the winner of the tournament.
It would be interesting as well to create a more comprehensive dataset with additional attributes such as the players playing and their FIFA ratings, as well as teams' overall FIFA rating. The previously used dataset was easy to understand, but more features could help achieve even better accuracy scores. |
